Why Mermaid Sucks and What I Did About It
I like Mermaid. I also think it's a dead end for anything serious. Let me explain.
I spent the last few weeks building chartcraft.dev — an AI-first diagramming tool that lets you describe what you want in plain English and get a diagram that you can adjust (with a reasonable degree of freedom).
My first approach was to use Mermaid because this is what everyone uses for diagrams these days. Then I ripped it all out and rebuilt from scratch with React Flow, ELK.js, and a lot of math I didn't expect to need.
This is the story of why, and what I learned.
Why Mermaid is genuinely great
Credit where credit is due. Mermaid is a text DSL (domain specific language) for diagrams — you type A --> B --> C and get a flowchart. No dragging boxes around, no fiddling with alignment. Developers love it because it lives in markdown, renders in GitHub READMEs, and version-controls like code. It has the largest representation in LLM training data of any diagram syntax, which means LLMs can generate valid Mermaid mots of the time without any special prompting. The syntax is fairly compact — up to 20× fewer tokens than equivalent BPMN XML for the same diagram.
For quick documentation? Mermaid is perfect. For quick sketches in a README? Unbeatable. For building an AI-first diagramming product? It's a trap.
Where Mermaid falls apart
Three problems killed it for me.
Static SVG output. Mermaid renders to SVG and that's it. You can look at the diagram, but you can't touch it. No dragging nodes. No relabeling. No reconnecting edges. For a quick documentation tool, fine. For something where a user prompts an AI to generate a diagram and then wants to tweak it — unacceptable. Of course you can regenerate the whole diagram with new labels, but good luck making it consistent. The whole point of AI-generated diagrams is that they get you 80% of the way there, and then you refine. Mermaid gets you to 80%, but then you're on your own.
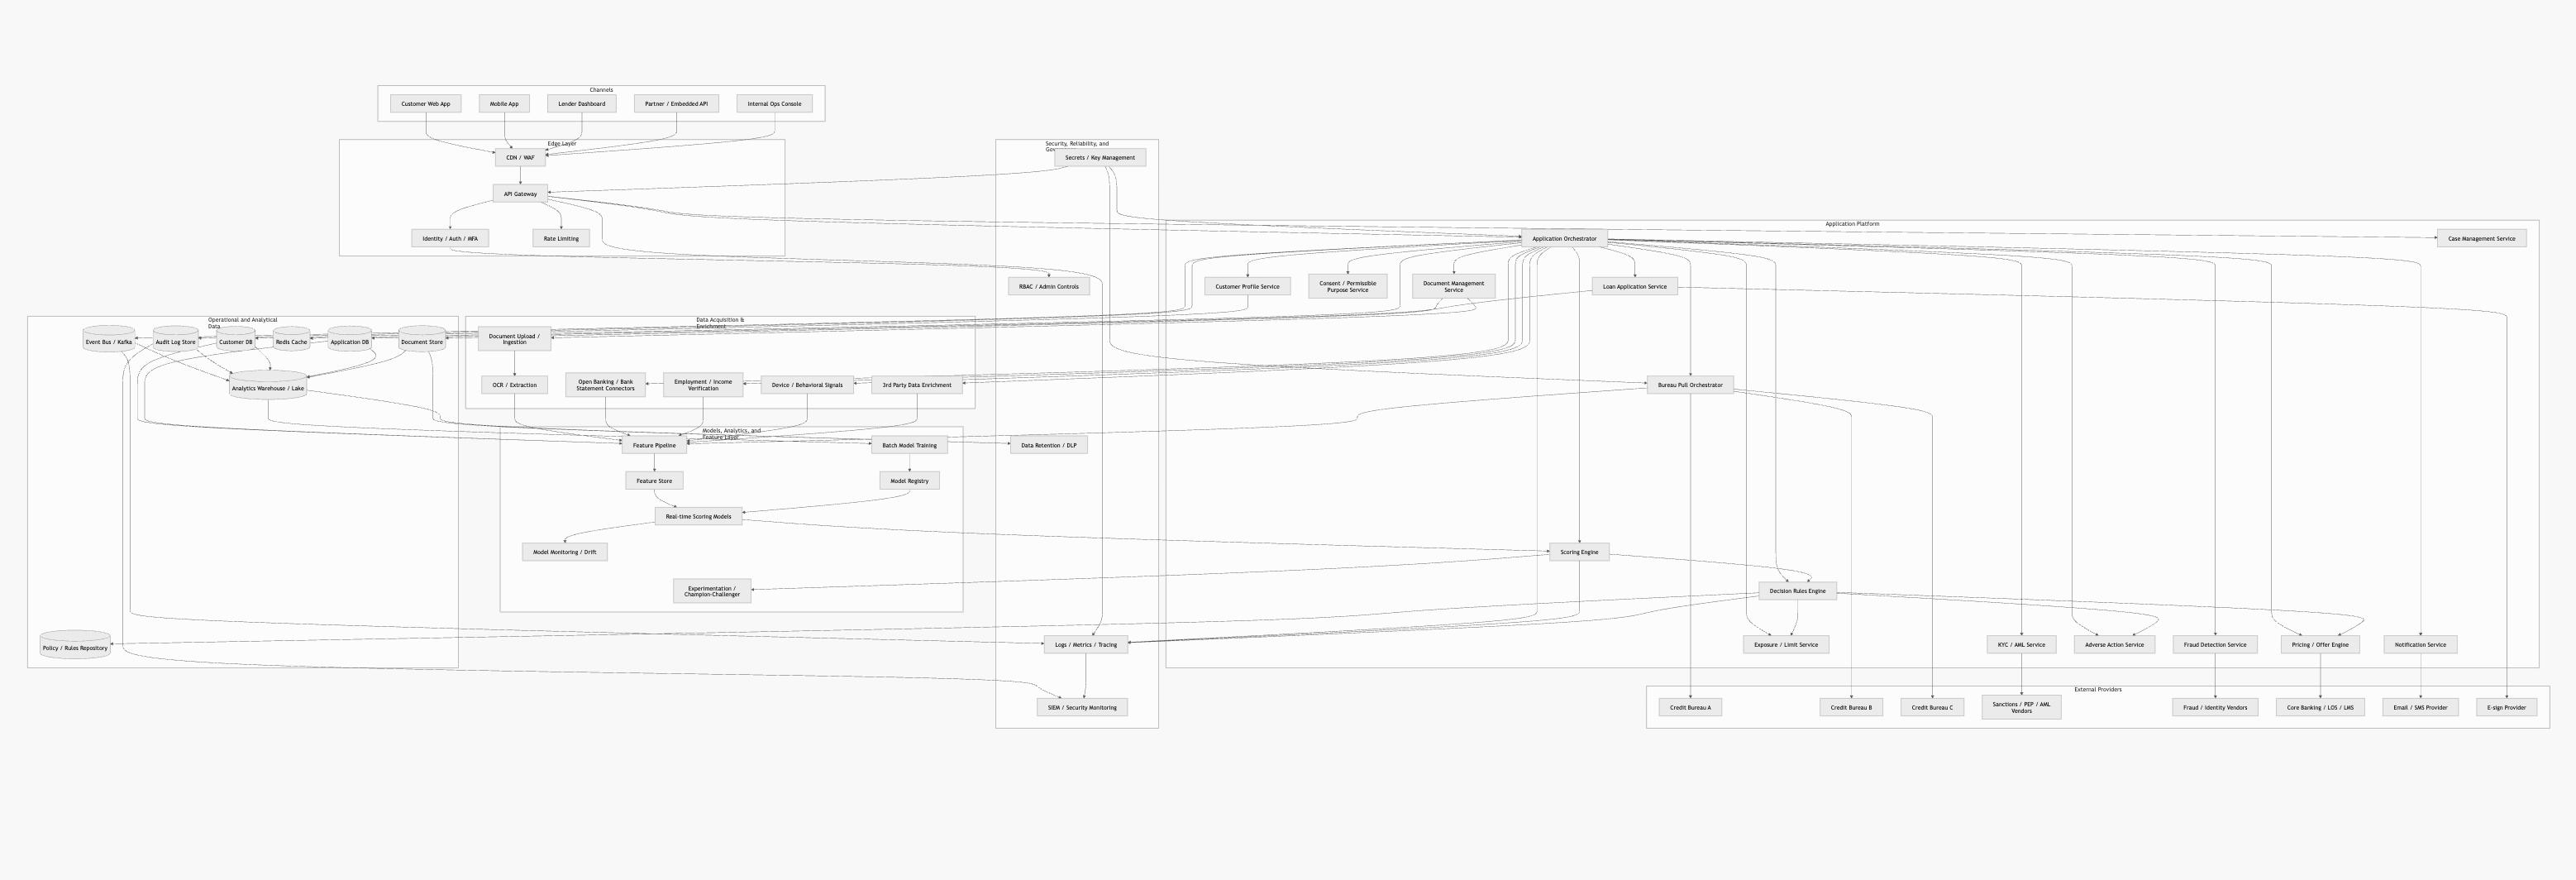
Fragile layout. Once a diagram gets past 10–15 nodes, Mermaid's layout engine starts producing crossing lines, overlapping labels, and generally ugly output. There's no manual override — you can't tell it "put this node over there." You're at the mercy of the auto-layout algorithm, and it doesn't handle complex graphs well:
No BPMN support. This one is straightforward. There's been an open GitHub issue (#2623) requesting BPMN support since 2018 with only some activity starting last month (as of April 2026). Flowcharts can fake a process flow, but they don't have gateways, pools, lanes, or event types. If you're targeting anyone who does process modeling — and in enterprise, that's a lot of people — Mermaid simply can't do it.
The insight that unlocked chartcraft for me: decouple generation from rendering entirely. The LLM doesn't need to produce a DSL that doubles as the renderer. It can produce structured JSON that feeds into a real graph library.
What I built instead
Chartcraft uses a pipeline: natural language → Claude API → structured JSON → React Flow + ELK.js → interactive diagram.
React Flow is the rendering layer. MIT-licensed, 35K+ GitHub stars, and its data model is just arrays of nodes and edges — trivially simple JSON that any LLM generates with high reliability. A node is {id, type, data, position}. An edge is {id, source, target, label}. Custom nodes are React components, so building a UML class box or an ERD table is just writing JSX. You get drag, relabel, reconnect, zoom, pan, and minimap for free.
The catch: React Flow has no built-in layout engine. It gives you an infinite canvas and says "do whatever". This is where it got interesting.
ELK.js (Eclipse Layout Kernel compiled to JavaScript) handles automatic positioning. When the LLM generates a graph, it produces nodes and edges with no coordinates — it doesn't know or care where things should be visually. ELK.js takes that topology and computes a hierarchical layout: x/y positions for every node, bend points for every edge, respecting things like flow direction, node sizes, and edge crossing minimization.
This sounds simple until you actually try it. Getting ELK.js to produce good layouts required a surprising amount of work — tuning spacing algorithms, handling edge cases (pun intended) with self-loops and multi-edges, computing proper node dimensions based on content before layout runs, and dealing with the fact that the layout engine operates asynchronously while React Flow wants synchronous position data. More on this below.
The LLM pipeline is the part I'm most proud of. We receive the user's natural language input, pack in a system prompt containing the target JSON schema and several few-shot examples per diagram type. It generates structured JSON. Backend validates that JSON against the schema. If it's invalid — and it is, maybe 5–10% of the time — I send the error plus the malformed JSON back to the LLM for one correction attempt. This autofix loop pushes generation reliability above 95%.
The key architectural decision: the LLM never produces coordinates or layout information. It only generates topology — what nodes exist, what they contain, how they connect. All spatial reasoning is delegated to ELK.js. LLMs are good at understanding structure and relationships. They're not good at elaborate 2D coordinate geometry, especially when the goal is a visually pleasing result.
The math nobody warned me about
I expected the component integration to be the hard part, but the devil was in the details; details being edge cases and making various types of diagrams look good.
When you auto-layout a graph, you need to know each node's dimensions before you compute positions — otherwise the layout engine can't prevent overlaps. But node dimensions depend on content (a class with 12 methods is taller than one with 2), and in React, you don't know rendered dimensions until the component actually mounts in the DOM. So you end up doing a two-pass render: invisible first pass to measure, layout computation, then visible render with positions. Or you pre-compute dimensions from the data model, which means your size estimation code has to match your React component's rendering exactly. Both approaches have edge cases that will haunt you.
Edge routing is another rabbit hole. Straight lines between node centers look sloppy. You want edges that exit from logical ports, route around obstacles, and use smooth curves. ELK.js gives you bend points for orthogonal routing, but converting those into smooth Bézier curves that React Flow can render requires interpolation math — and it needs to look good at every zoom level.
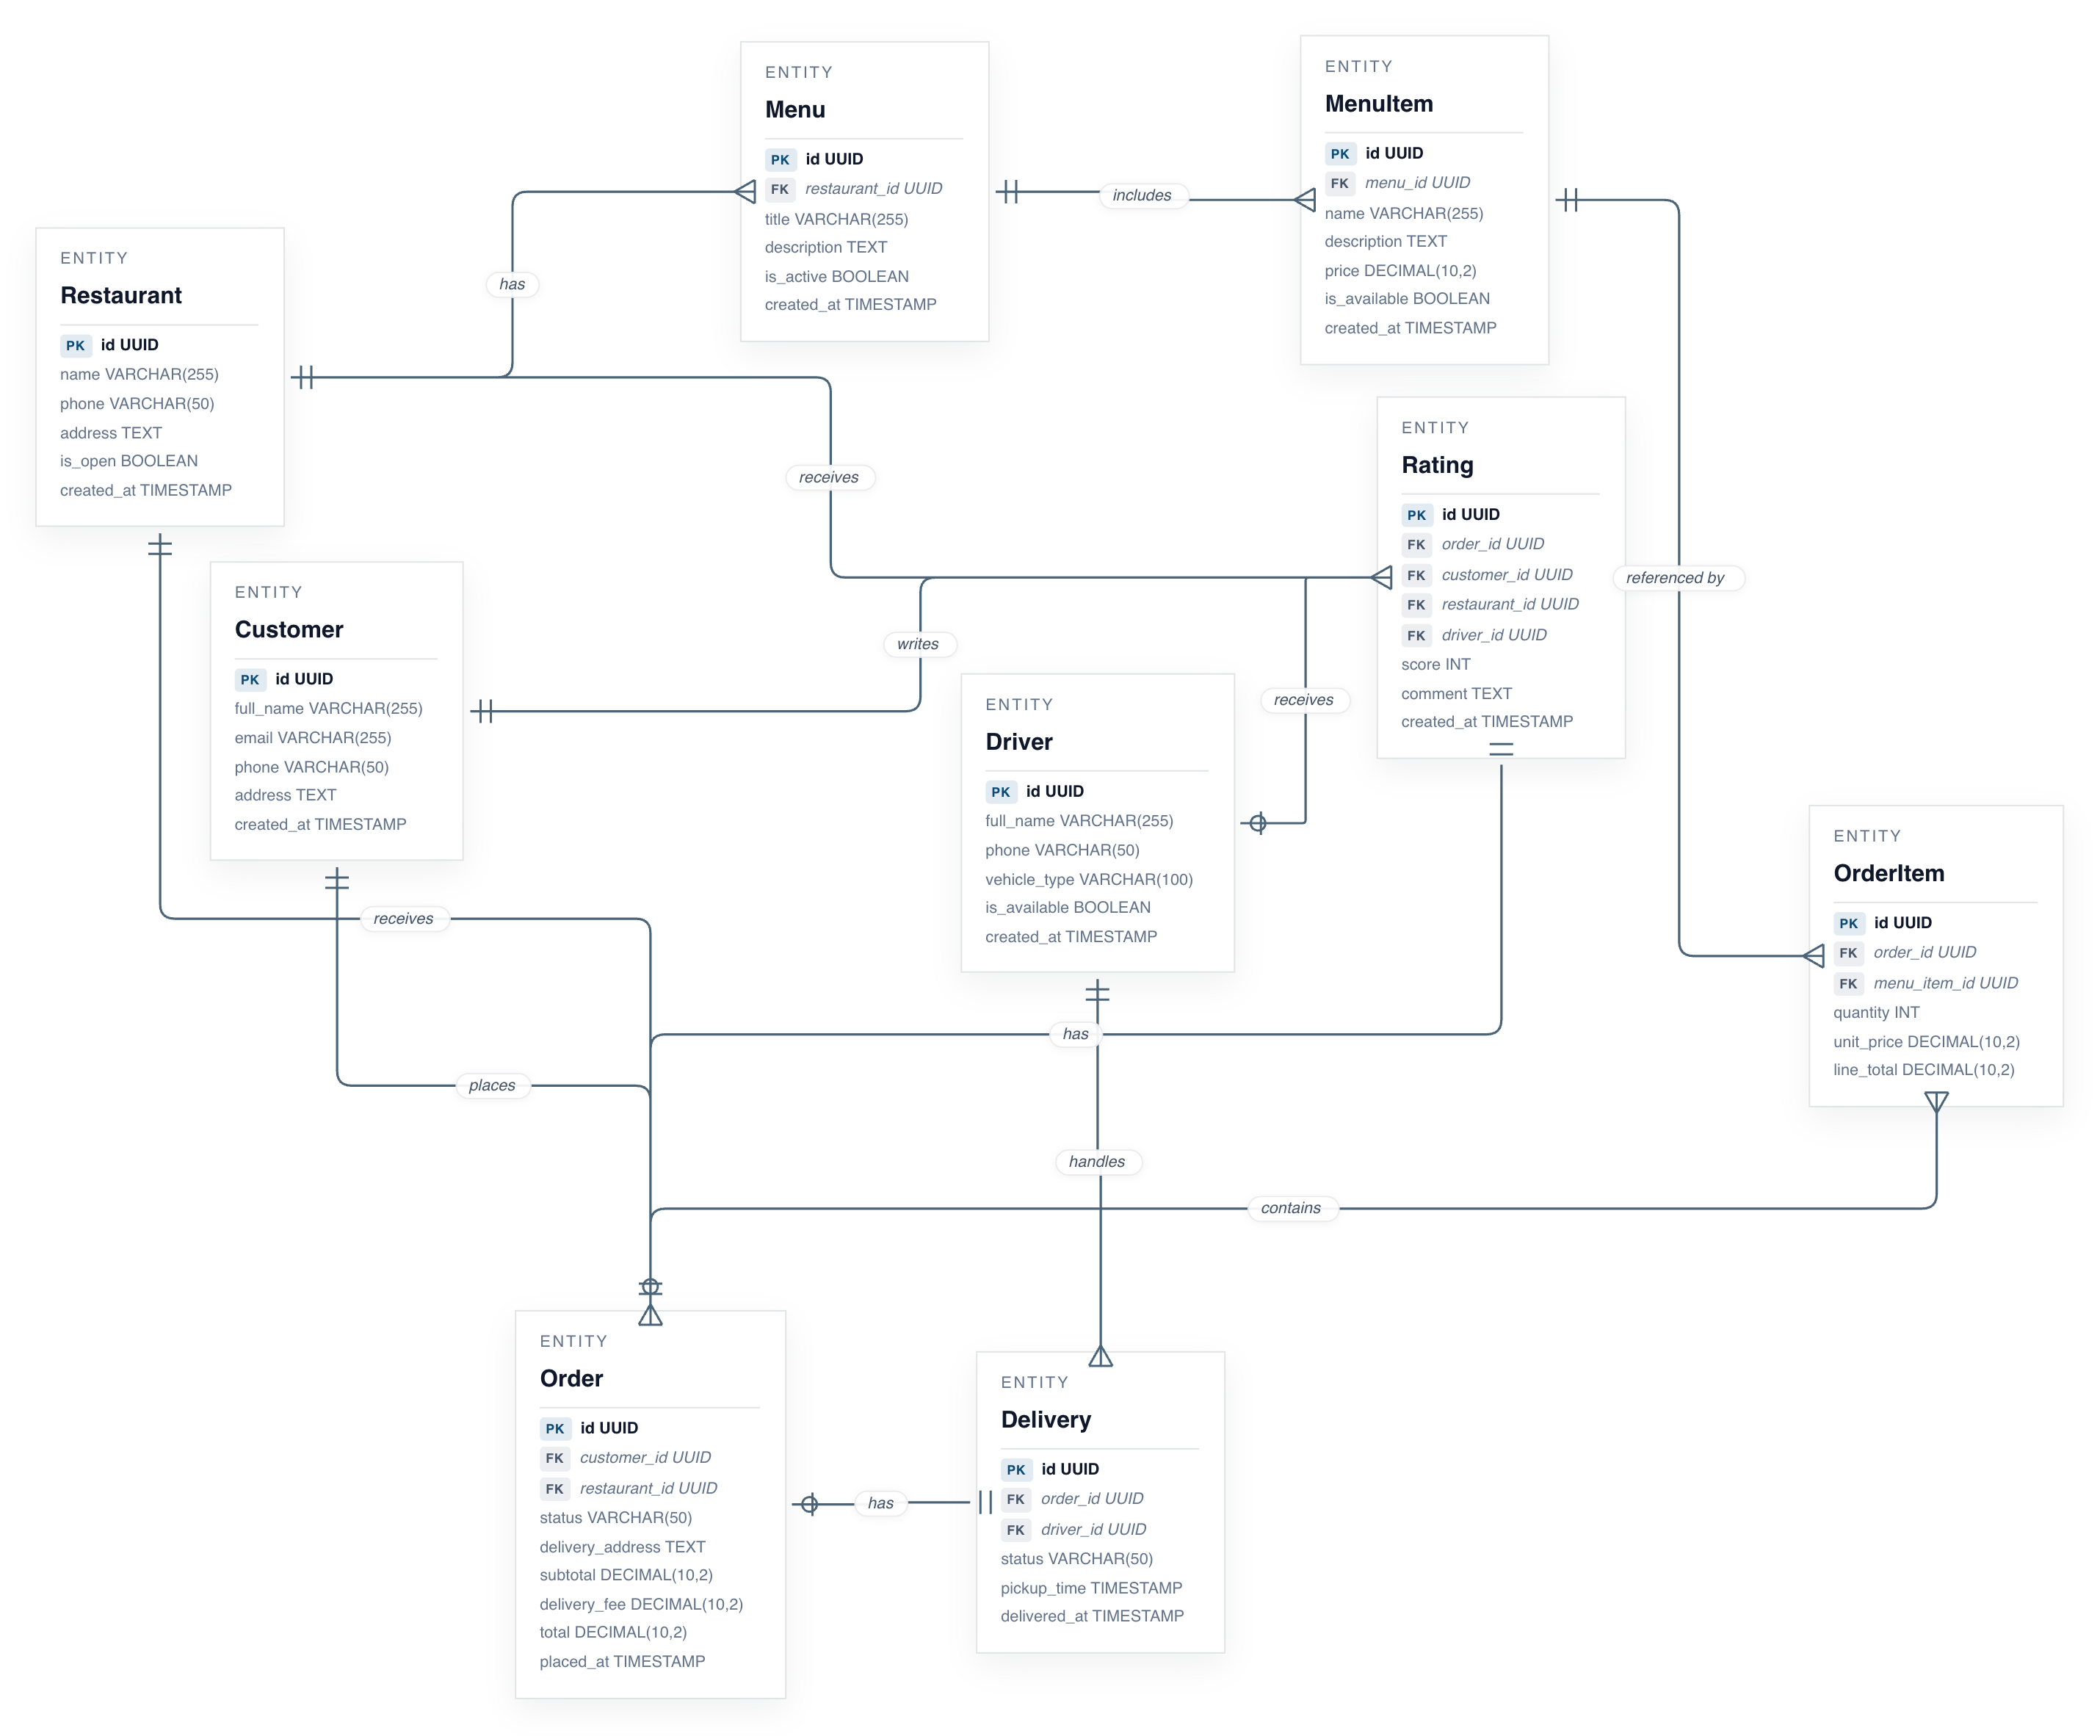
This ERD beauty is a simple prompt in chartcraft with minimal manual adjustments:
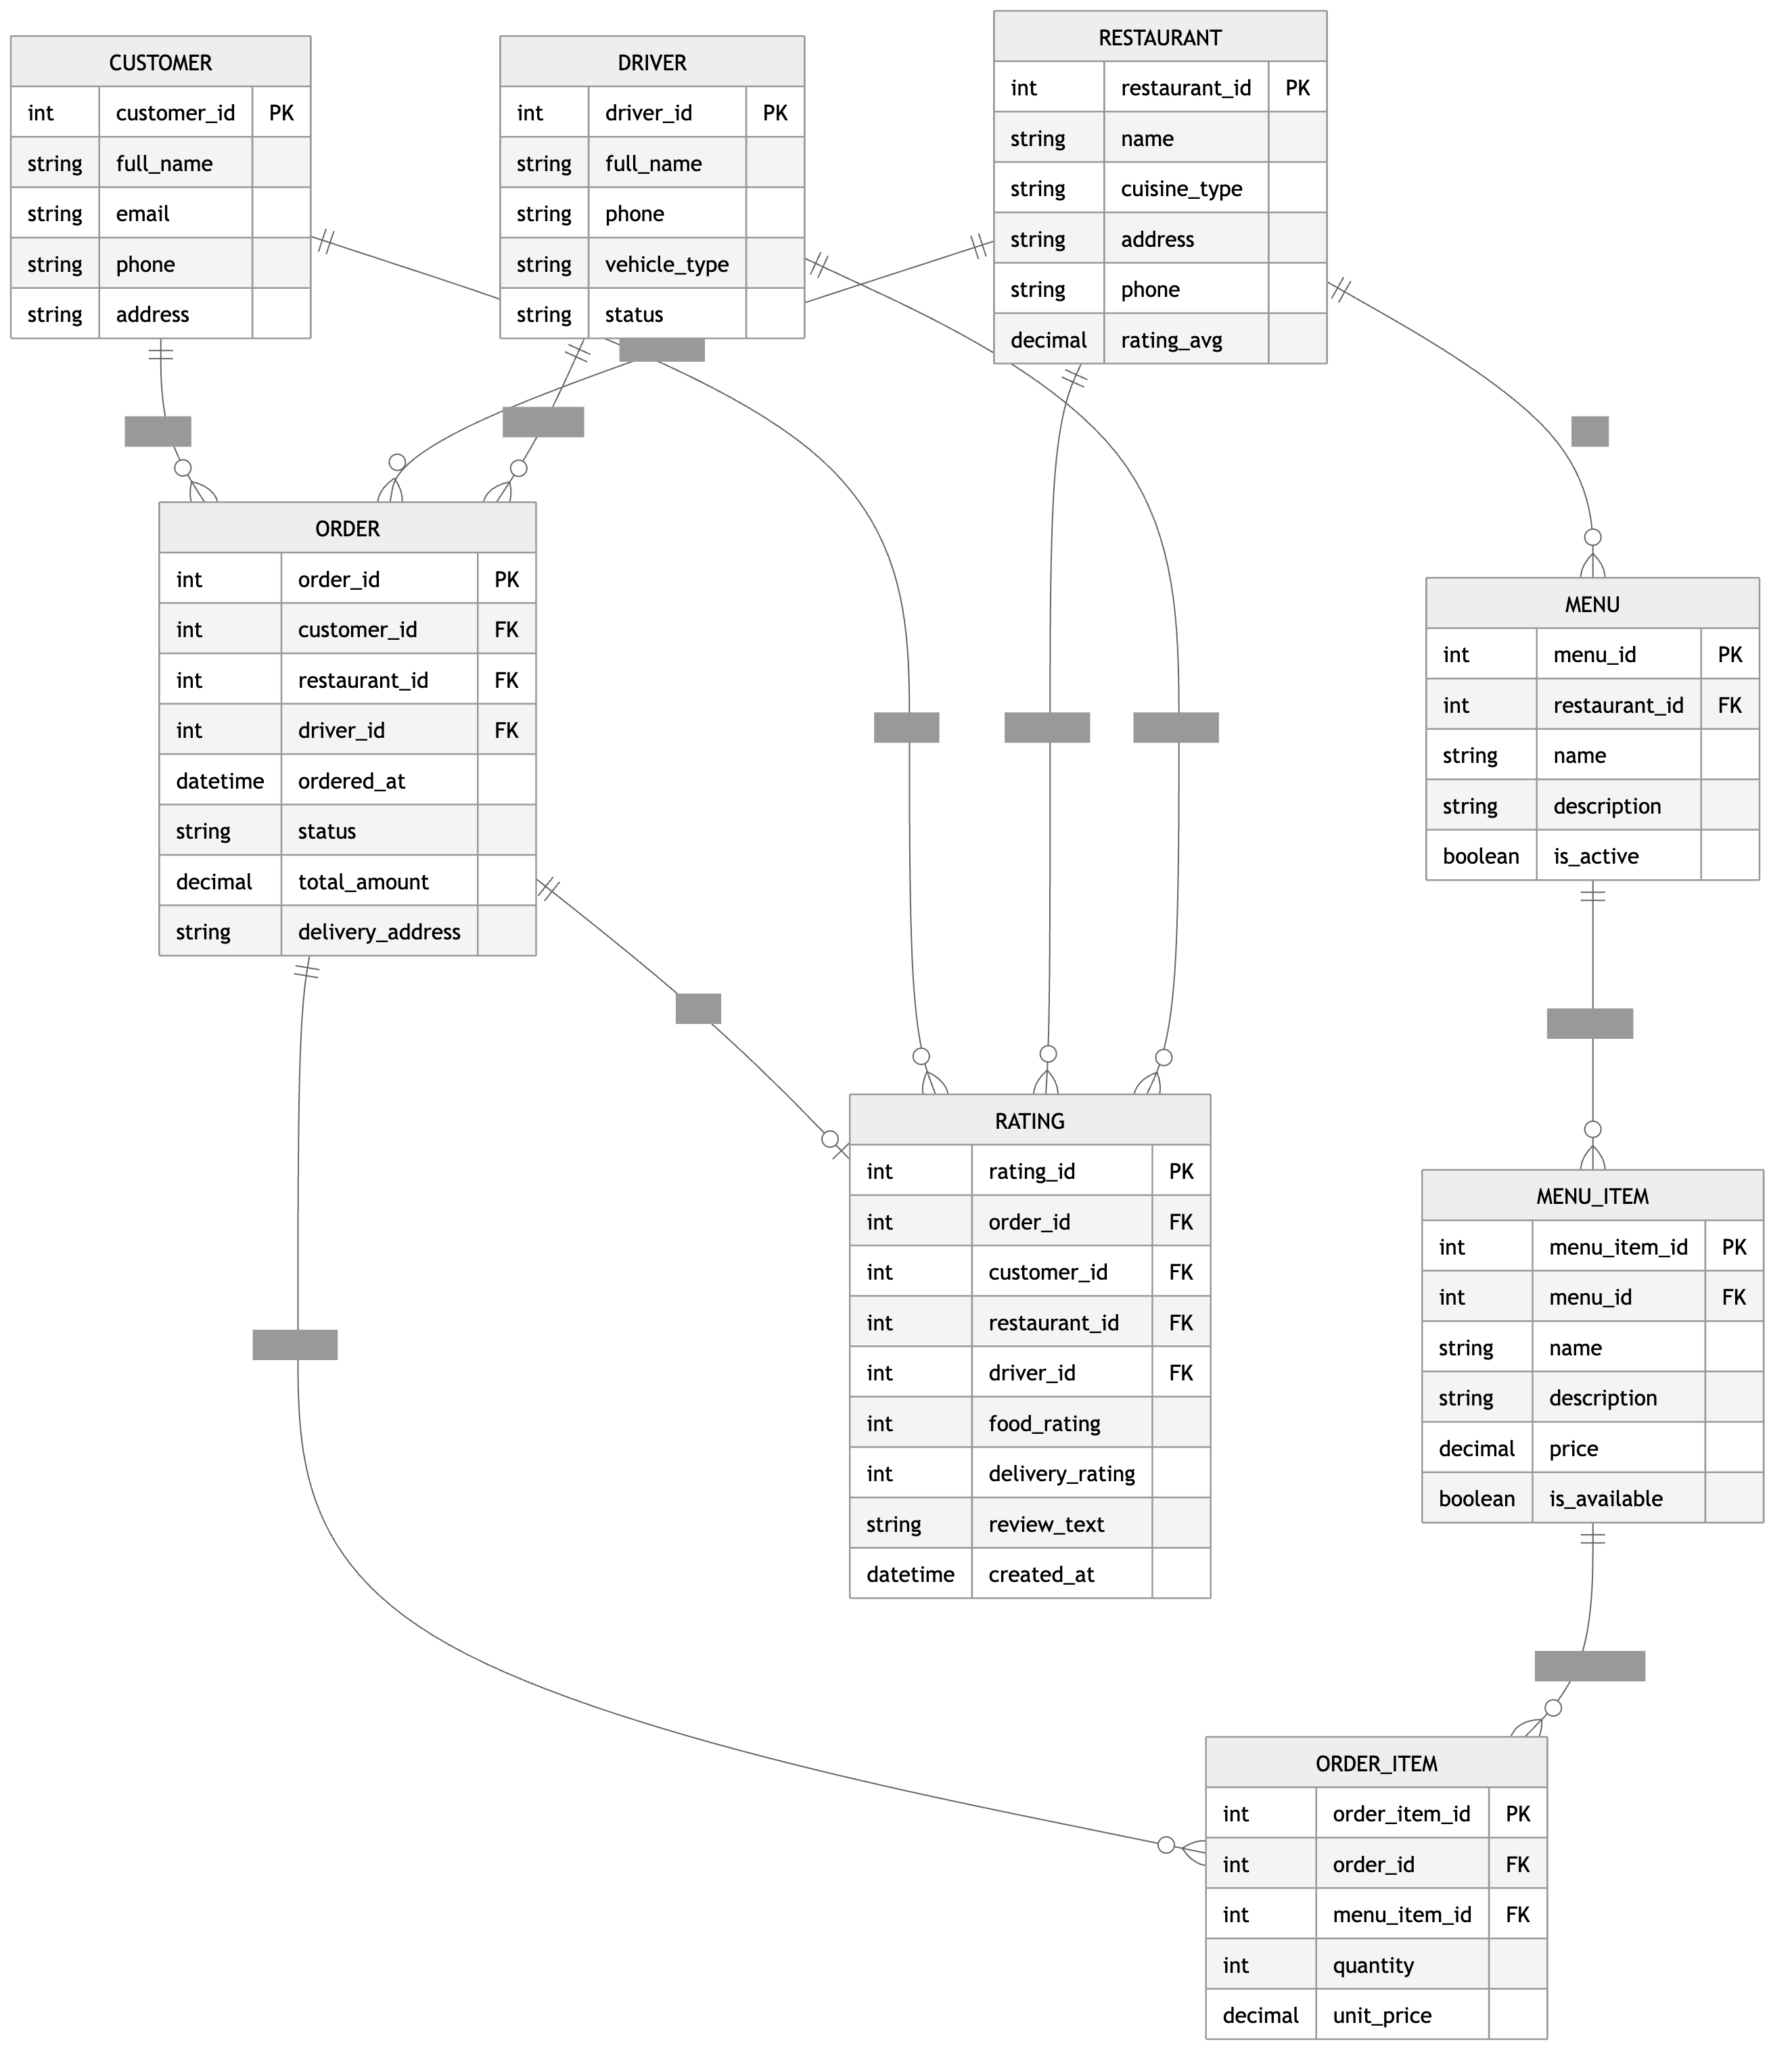
For comparison: same prompt, ChatGPT:
None of this is in any tutorial. You just find it when you ship. Here's the breakdown of some of the non-trivial algorithms that ended up in the codebase.
Graph algorithms
DFS tri-colour back-edge detection
Layered layout requires a DAG. Real diagrams have cycles — retry loops, feedback flows. We must identify and temporarily remove the cycle-creating edges before layout, then reintroduce them as specially routed loops.
Each node carries a colour state:
| Colour | Meaning |
|---|---|
| 0 (white) | Not yet visited |
| 1 (grey) | On the current DFS call stack (ancestor) |
| 2 (black) | Fully processed, all descendants explored |
visit(u):
  state[u] = grey
  for each edge (u → v):
    if state[v] == grey  → back edge (v is ancestor → cycle)
    if state[v] == white → visit(v)
  state[u] = black
Grey target = ancestor on current path = cycle. Black target = finished sibling branch = not a cycle. BPMN fork-join patterns produce many black-target edges; misclassifying them would strip legitimate forward edges and break the layout.
Critical-path topological BFS (modified Kahn's)
Each node must be assigned to a vertical layer (column). Standard Kahn's topological sort assigns each node the first valid level. We assign the maximum across all predecessors:
level[v] = max(level[u] + 1) for all predecessors u of v
This is the critical-path method — same math as PERT/CPM in project scheduling. It guarantees every predecessor chain has room for intermediate nodes without edges skipping layers.
A → B → D
A → C → E → D

Levels: A=0, B=1, C=1, E=2
D = max(B+1, E+1) = max(2, 3) = 3
Using min or first-seen would assign D=2, forcing the path through E to skip a layer.
ERD topological sort
ELK's crossing-minimisation (LAYER_SWEEP) is sensitive to initial node ordering. ERD entities are sorted by their critical-path level before being handed to ELK, giving LAYER_SWEEP a near-optimal starting point rather than an arbitrary one.
Optimisation via ELK
I delegate 2D placement to the Eclipse Layout Kernel. These are ELK internals selected by configuration.
Coffman–Graham layering
Default layered layout assigns each node its own layer — long horizontal chains. Architecture diagrams with groups need denser 2D packing.
elk.layered.layering.strategy = COFFMAN_GRAHAM
Coffman–Graham assigns nodes to layers while minimising the number of layers for a fixed maximum layer width W. Originally designed for multiprocessor scheduling. Multiple groups can share a layer → compact arrangement.
Network simplex node placement
Within each layer, nodes need y-coordinates that minimise total edge length. A greedy approach finds local optima; we need global optimality.
elk.layered.nodePlacement.strategy = NETWORK_SIMPLEX
Formulates y-coordinate assignment as a minimum-cost flow problem on a network derived from graph edges (Gansner et al. 1993). Solves exactly — not a heuristic. Same algorithm as Graphviz dot.
Hierarchical edge splitting
Diagrams with nested groups have both internal and cross-group edges. ELK must see these correctly for valid layer computation.
elk.hierarchyHandling = INCLUDE_CHILDREN
All nodes and groups participate in a single layer assignment. Edges inside a group are declared in that group's edges array; only cross-group edges go at root. Without this split, ELK treats internal edges as cross-hierarchy connections and miscomputes layers.
Crossing-minimisation heuristics
Median heuristic (BPMN row ordering)
BPMN swimlanes stack multiple nodes vertically in the same column. Row ordering determines edge crossings — a bad ordering creates a tangled diagram.
For node v with predecessors at row positions [r₁, r₂, …, rₙ]:
desiredRow(v) = median([r₁, r₂, …, rₙ])
Why median, not mean? The median minimises ∑|xᵢ − c| (sum of absolute deviations), which directly corresponds to total edge length. The mean minimises ∑(xᵢ − c)² and is pulled by outliers. Predecessors at rows [1, 3, 15]: mean = 6.33 (biased toward outlier), median = 3 (stable). This is the standard median heuristic from the Sugiyama framework.
Branch-label bias
Gateway "Yes"/"No" branches have conventional meaning — the happy path should stay in-lane, exceptions should detour. Pure median heuristic doesn't encode this domain knowledge.
score("yes" / "ok" / "approved") = −1  → pull upward
score("no" / "reject" / "invalid") = +1 → push downward

desiredRow(v) = median(predecessorRows) + branchBias × 0.35
The 0.35 damping factor prevents labels from overriding the median — they nudge, not dictate.
Nearest-free-row collision resolution
The desired row is a real number; available rows are non-negative integers. Multiple nodes may want the same row.
start = round(desiredRow)
for step = 1, 2, 3, …:
  try (start − step), then (start + step)
  return first unused
Spiral outward from the desired position. O(n²) worst case, but n < 10 per lane per column in practice.
Angle-threshold handle assignment
React Flow nodes have four connection handles (top, right, bottom, left). If all outgoing edges use the same handle, they overlap into one thick line.
Primary pass (θ = 45°):
dx = target.x − source.x,  dy = target.y − source.y
if |dy| ≥ |dx| × tan(45°):  top/bottom
else:                         left/right
Conflict pass (θ = 25°): When multiple edges share a source handle, recompute with a tighter cone:
tan(25°) ≈ 0.466
if |dy| ≥ |dx| × 0.466:  → reassign to top/bottom
The narrower cone captures edges at moderate angles (25°–45°) and redistributes them, reducing overlap.
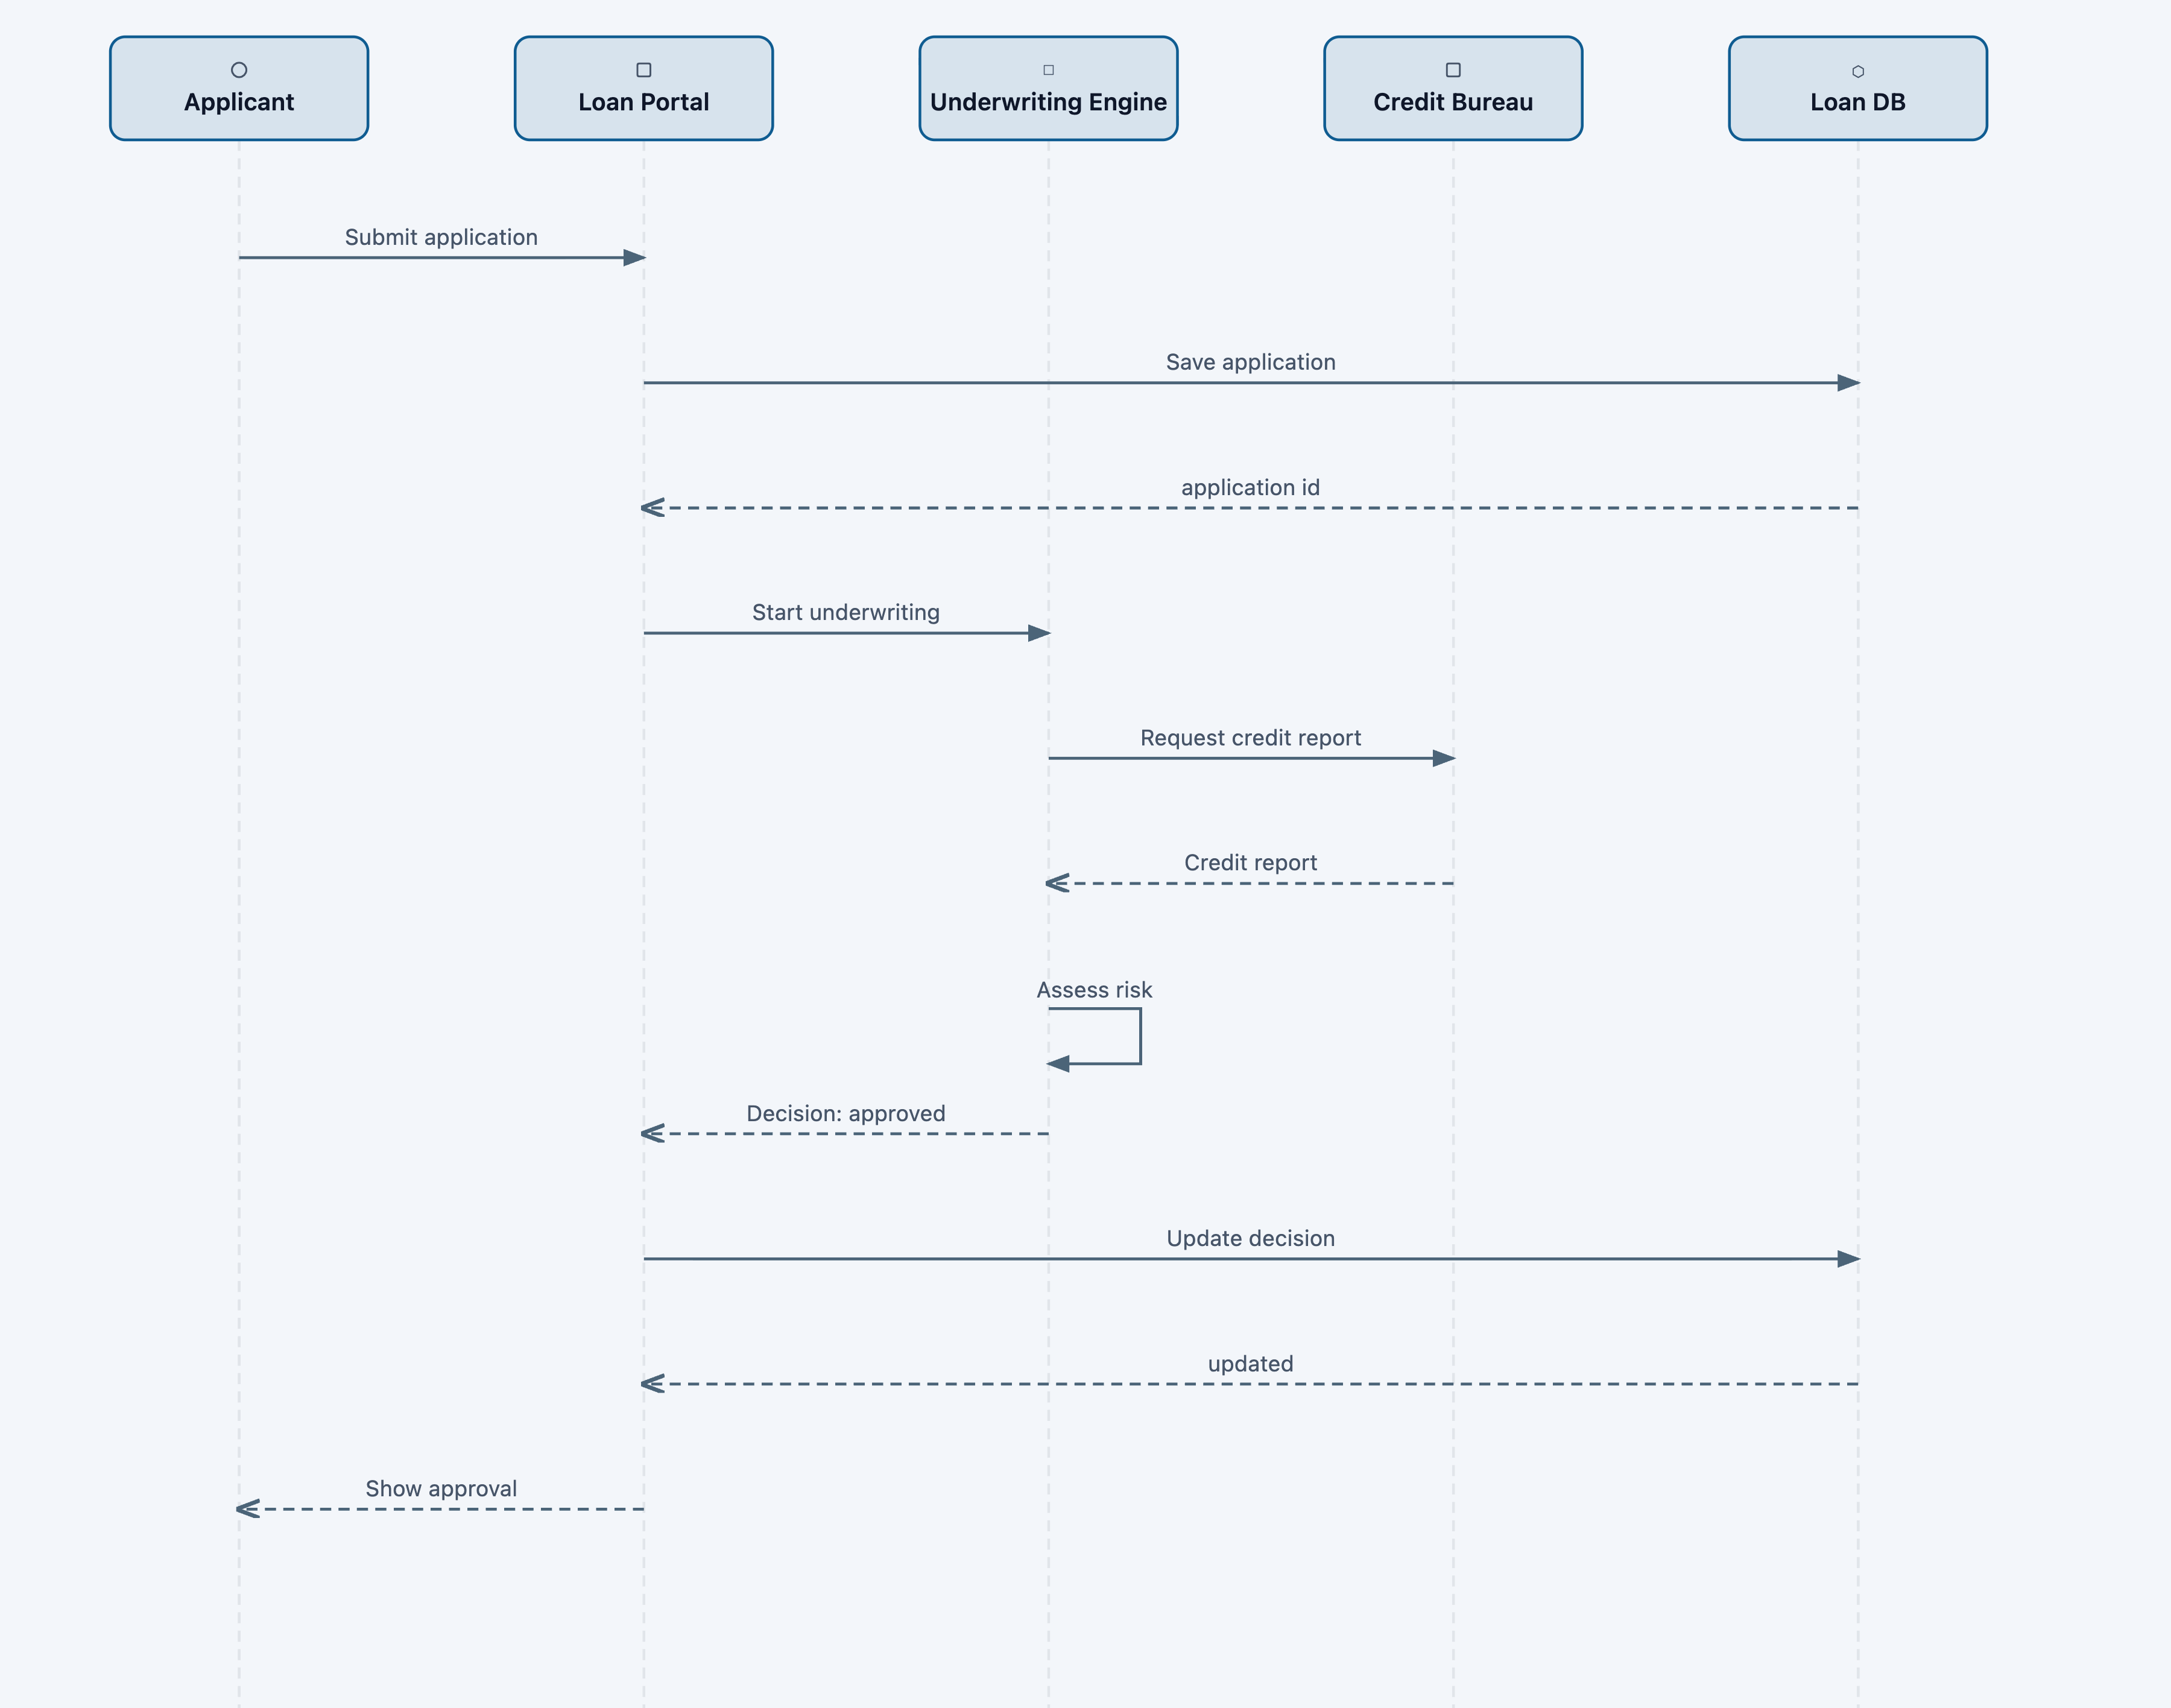
Sequence diagrams are now as easy as one-two-three:
Computational geometry
Orthogonal edge routing (BPMN)
BPMN requires axis-aligned edge segments. Three cases need different routing strategies depending on spatial relationship between source and target.
Same-lane forward: Vertical bend at the midpoint of the horizontal gap, clamped:
bendX = sourceRight + clamp((targetLeft − sourceRight) / 2, 28, 96)
Cross-lane forward (L-shape vs Z-shape): When vertical displacement is large relative to horizontal gap, a midpoint bend creates an ugly Z. We detect this and bend early:
if yDiff > gap × 0.8:
  ratio = 0.28   → bend at 28% of gap (near source → clean L-shape)
else:
  ratio = 0.5    → bend at midpoint (Z-shape acceptable)

bendX = sourceX + gap × max(0.15, ratio)
Back edges (cycle loops): Route outside the lane stack with stacked parallel tracks:
outerY = laneBoundary ± (14 + track × 12)
exitX  = sourceRight + 16 + track × 8
entryX = targetLeft  − 16 − track × 8
Multiple loops between the same column pair nest without collision.
Quadratic Bézier corner rounding
Sharp 90° corners in orthogonal paths look mechanical and make edges hard to trace visually. At each interior waypoint curr between prev and next:
û₁ = normalize(curr − prev)
û₂ = normalize(next − curr)
r  = min(radius, |prev→curr|/2, |curr→next|/2)

arcStart = curr − û₁ × r
arcEnd   = curr + û₂ × r
SVG: L arcStart Q curr arcEnd
The quadratic Bézier uses the original corner as its control point — tangent to both segments. The min(r, len/2) clamp is the key invariant: it prevents arc start/end from overshooting the midpoint of short segments.
Just look at this beauty:
Back-edge drag correction
When nodes are dragged, precomputed back-edge waypoints become stale. The loop must track the node while preserving its visual clearance.
clearance = original outerY − original node boundary
adjustedY = live node boundary + clearance
Preserves the original distance between loop and lane regardless of drag displacement.
Longest-segment label placement
Edge labels on short segments overlap with corners. Labels need the segment with the most available space.
for each segment (i → i+1):
  len = hypot(Δx, Δy)
  if len > maxLen → labelPos = midpoint(segment)
Sequence diagram linear layout
Sequence diagrams have no graph structure — participants are linearly ordered, messages are vertical slices. Layout is pure arithmetic.
participantX(i) = 110 + i × 220
messageY(j)     = 120 + j × 68
canvasWidth     = max(400, n × 220 + 80)
canvasHeight    = 120 + max(1, m) × 68 + 60
Self-calls: rectangular loop M x,y → x+50,y → x+50,y+30 → x,y+30.
Multiplicative zoom
Linear zoom (add constant per tick) feels fast when zoomed out and sluggish when zoomed in. Perceived zoom speed should be uniform.
factor = deltaY < 0 ? 1.1 : 0.9
s′ = clamp(s × factor, 0.25, 2.5)
Each tick multiplies by a fixed factor. Three zoom-ins: 1.0 → 1.1 → 1.21 → 1.331. Constant percentage increase → logarithmic scale → perceived as uniform. Same reason audio volume knobs use log scales.
TL;DR
Mermaid turns diagrams into text. Chartcraft turns text into beautiful diagrams that you can edit.
Try it at chartcraft.dev — and if your diagram breaks it, I want to see it.